
Your workspace
The Dashboard adapts to your screen. You can change the overall scale, the screen layout, the panes in the center and the text sizes.
Panes
The center of the Dashboard is split into panes, and each pane can show one of:
- Visualize – the 3D toolpath viewer
- Edit – the G-code editor
- Macros – the macro editor
- Probe – probing tools
- Console – the controller console
Each pane has its own row of tabs to choose what it shows, and two buttons at its right end to split it top-and-bottom or side-by-side. Drag the dividers to resize.
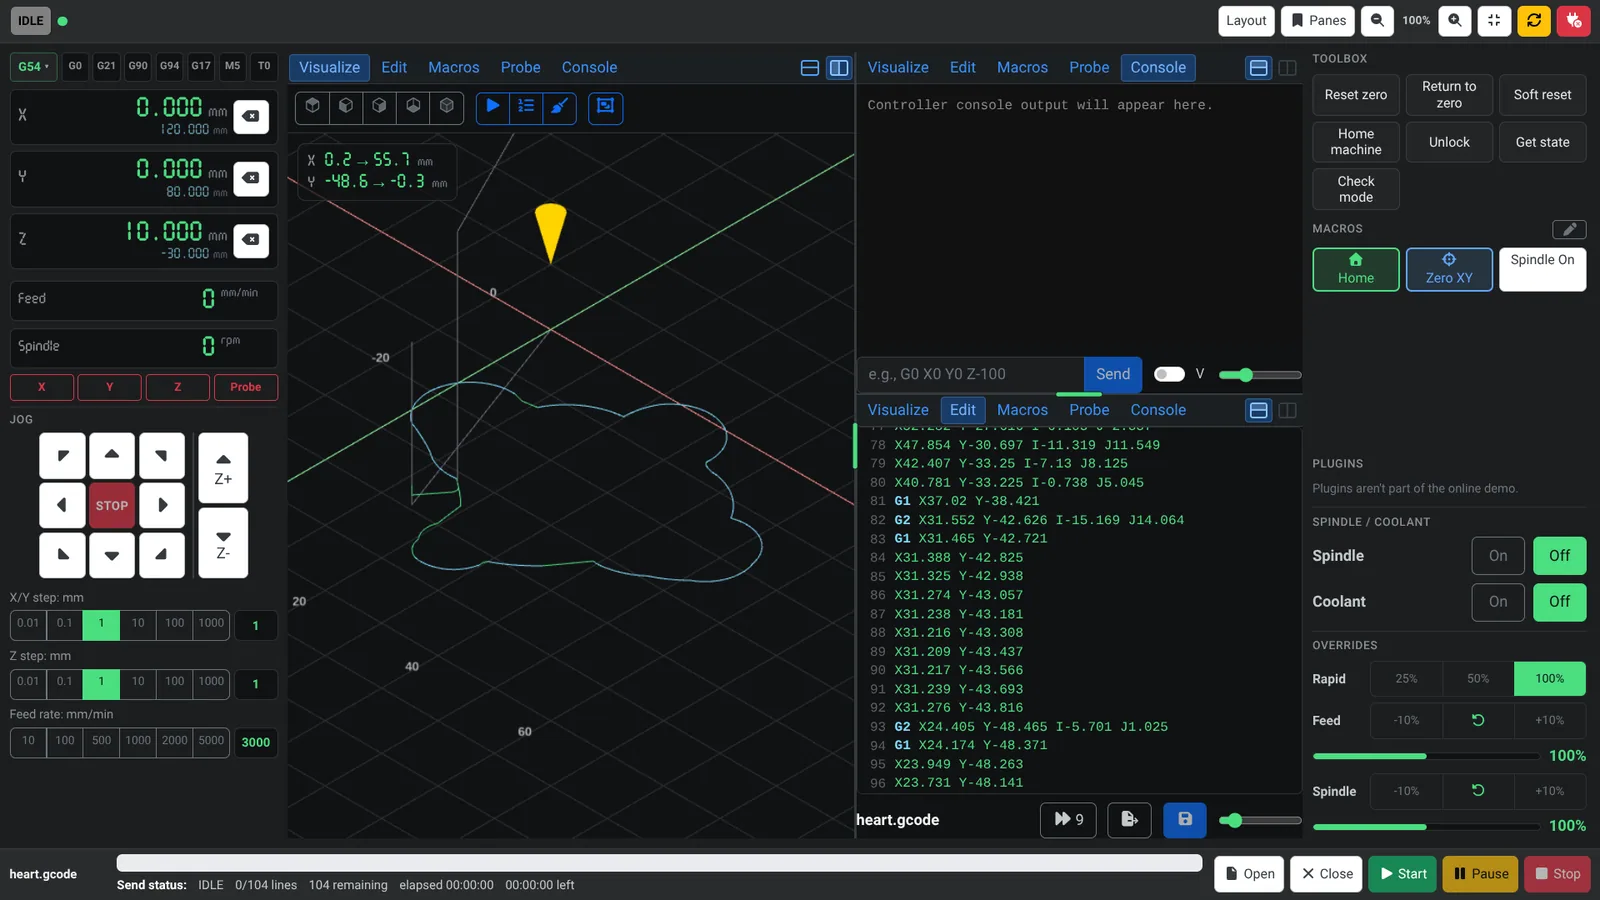
Put a large editor next to the toolpath when you're working on the code, or give the toolpath most of the room when you're setting up a job.
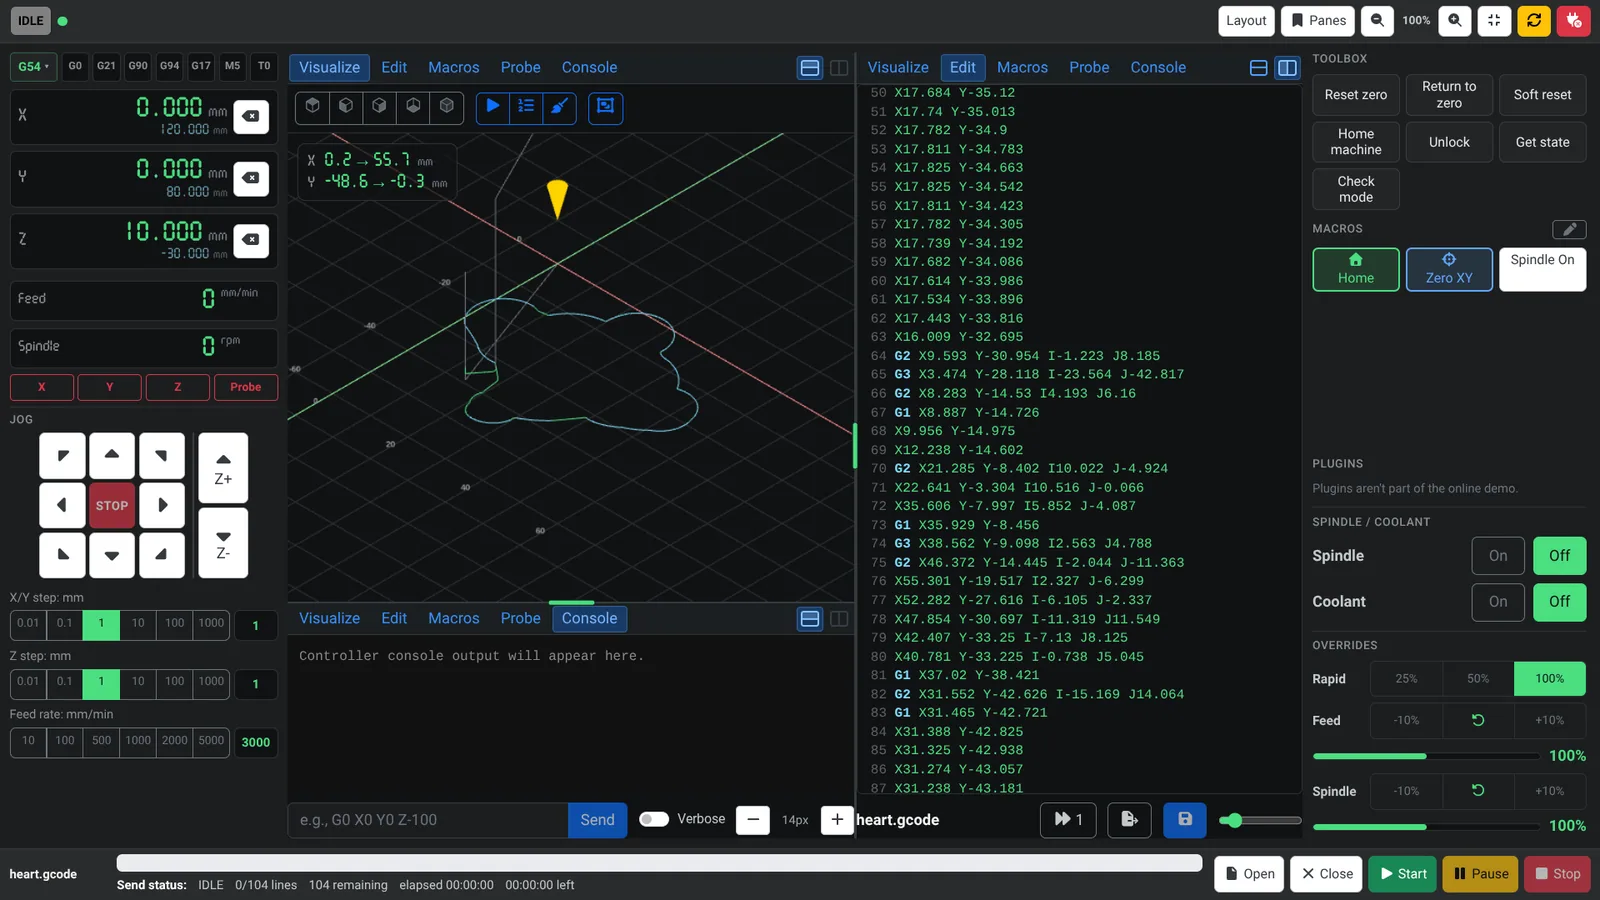
In the Visualize view you can switch between top, left, right, bottom and 3D views. The Panes button in the top bar saves and restores your pane arrangements. See Saved layouts & backup.
Screen layout
Open the Layout button in the top bar. Screen layout offers:
| Option | What it does |
|---|---|
| Auto | Adapts to the available width. |
| Desktop | Three columns. |
| Tablet | Controls plus a workspace. Macros and overrides move to the Machine tab. |
| Tabbed | One panel at a time, for narrow screens. |
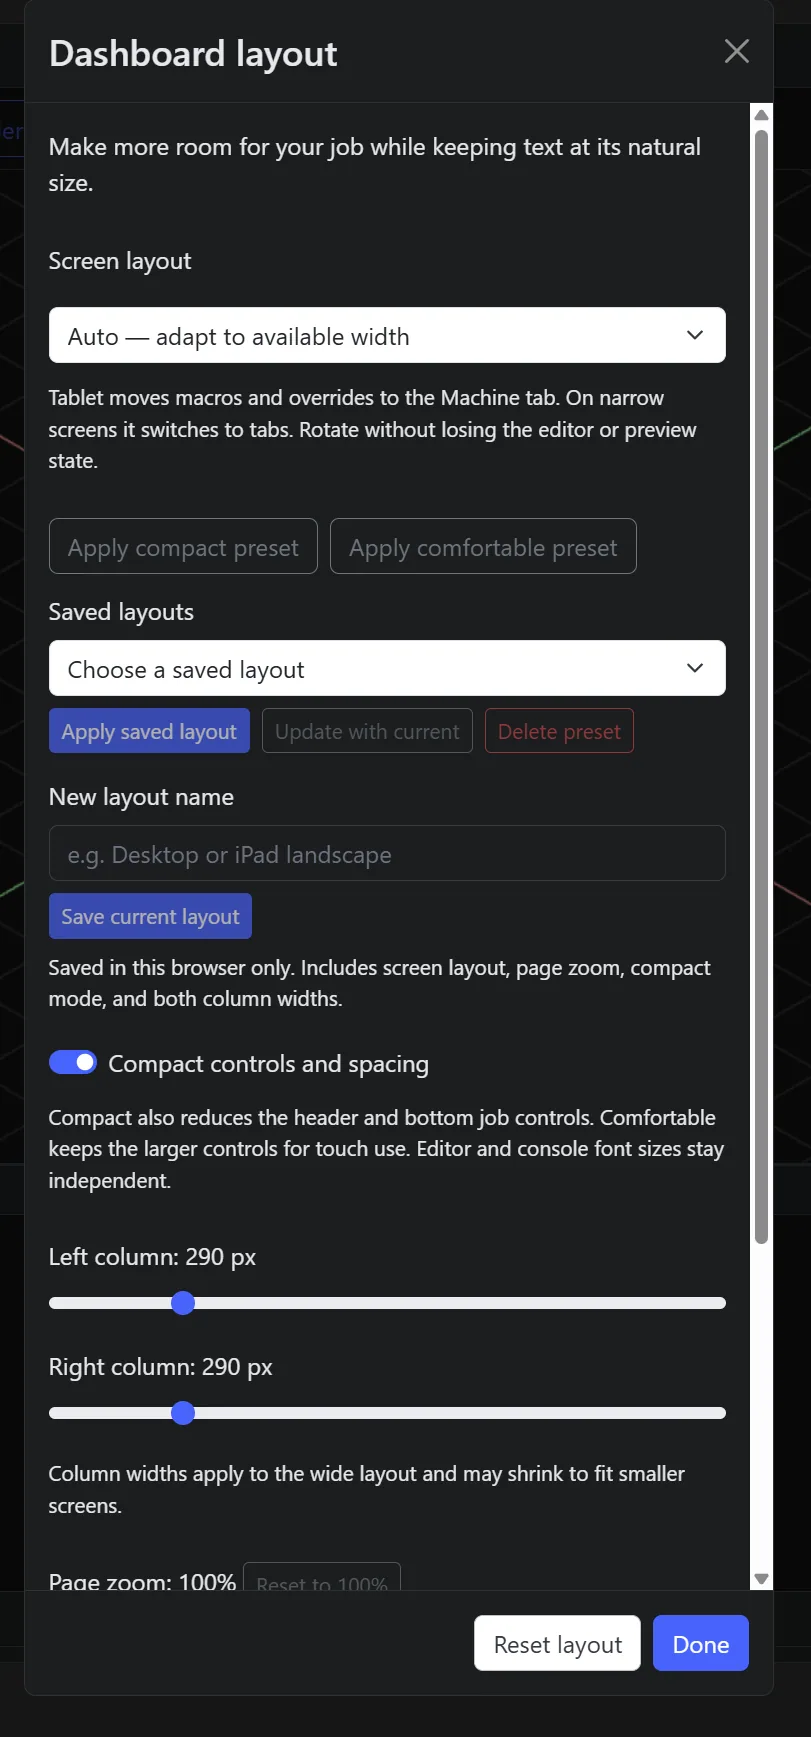
The same dialog has a Compact controls and spacing switch (comfortable spacing is better for touch), sliders for the left and right column widths, and a page zoom readout. See On any screen for how these look on a tablet and a phone.
Zoom and text size
- Page zoom runs from 70% to 150%. Use the zoom buttons in the header, or reset it from the Layout dialog.
- Editor and console text sizes are independent of page zoom and of each other. Use the size controls in each panel.
- Fullscreen is a button in the header.